
Statistical tests are essential in dissertation research. They help analyze data, validate hypotheses, and draw meaningful conclusions. Choosing the right test ensures your results are accurate and reliable, which is critical for the success of your study.
However, many students struggle with selecting the correct statistical test. This is often due to the variety of tests available and the need to understand complex factors like data type, research design, and sample size. These challenges can make the process overwhelming, especially for beginners.
This article will simplify the process by providing a step-by-step process on how to choose the right statistical test for your dissertation, thesis, or research project. You’ll learn how to identify the most suitable test based on your data and research goals. So, whether you’re comparing groups, exploring relationships, or analyzing categorical data, this guide will help you make informed decisions and avoid common mistakes. Let’s get started!
What Are Statistical Tests?
Statistical tests are techniques used to analyze data and determine patterns, relationships, or differences between variables. They help researchers draw conclusions based on evidence rather than assumptions. The primary purpose of statistical tests is to validate or reject hypotheses, ensuring that findings are backed by data.
For example, if you hypothesize that study hours influence exam performance, a statistical test can show whether this relationship exists and how strong it is. By using the right test, researchers can uncover meaningful insights and support their research questions with confidence.
Why Choosing the Right Test Matters
Selecting the correct statistical test is crucial for ensuring the validity and reliability of your research findings. Using the wrong test can lead to inaccurate results, misinterpretation of data, and flawed conclusions.
For instance, applying a test meant for continuous data on categorical data can produce misleading results. Similarly, ignoring assumptions like normality or sample size can compromise the integrity of your study. Thus, by choosing the right test, you ensure that your analysis aligns with your research objectives and data characteristics, leading to trustworthy and impactful results.
Key Factors in Choosing the Right Statistical Test
Selecting the correct statistical test for your dissertation is like choosing the right tool for a job—it depends on the task at hand. To make the best choice, you need to understand several key factors about your data, research design, and study objectives. By focusing on these aspects, you’ll avoid common pitfalls and ensure your results are valid and reliable. Below, we break down the critical considerations that guide test selection.
Type of Data
Understanding the type of data you are working with is the first step in choosing the right statistical test. Data types are generally categorized into four levels:
- Nominal data: These are categorical variables with no inherent order, such as gender or hair color.
- Ordinal data: These variables have a meaningful order but lack equal intervals, like rankings (e.g., 1st, 2nd, 3rd) or satisfaction levels.
- Interval data: Numeric data with equal intervals between values but no true zero, such as temperature in Celsius.
- Ratio data: Numeric data with a true zero point, such as weight, height, or income.
The type of data determines which statistical tests are appropriate. For example, chi-square tests are suitable for analyzing nominal data, while interval or ratio data often require parametric tests like t-tests or ANOVA.
Identifying your data type ensures you use a test that aligns with your variables’ characteristics, thereby improving the accuracy of your results. Ignoring this step may lead to incorrect test selection, invalid conclusions, and reduced credibility of your research findings.
Research Questions and Hypotheses
Your research questions and hypotheses shape the direction of your analysis and influence the choice of statistical tests. The type of question you’re asking often determines whether you’re comparing groups, examining relationships, or identifying trends.
For example:
- If your research question is “Do students who study more hours perform better on exams?”, you might use a correlation or regression test to analyze the relationship between study hours and exam scores.
- If your hypothesis is “There is a significant difference in test scores between male and female students,” an independent samples t-test would be suitable to compare the means of two groups.
Aligning your statistical tests with your research objectives ensures that your analysis provides meaningful insights. Misalignment can result in irrelevant or misleading findings, undermining the purpose of your study.
By clearly defining your research questions and hypotheses, you set the foundation for selecting tests that validate your findings and contribute to your field of study. This clarity is essential, especially when explaining your choices to reviewers or advisors.
Study Design
The design of your study directly influences the statistical tests you choose. Research designs are broadly categorized into experimental and observational studies.
- Experimental designs involve manipulating one or more independent variables to observe their effect on dependent variables. For example, testing the impact of a new teaching method on student performance might require tests like t-tests or ANOVA.
- Observational designs focus on measuring variables as they naturally occur without intervention. For instance, exploring the relationship between exercise frequency and heart health may call for correlation or regression analysis.
Your study design may also include repeated measures (e.g., measuring the same group over time) or cross-sectional data (e.g., collecting data at one point in time). Tests like paired t-tests or repeated measures ANOVA are used for longitudinal designs, while cross-sectional studies may rely on chi-square tests or independent samples t-tests.
Understanding your study design ensures your statistical analysis aligns with how data was collected, leading to accurate and reliable results. Failing to consider design specifics can lead to incorrect test applications and weakened study credibility.
Number of Variables
The number of variables in your study plays a significant role in determining the appropriate statistical test. Variables can be categorized as independent (predictor) or dependent (outcome).
- Single-variable analysis focuses on one dependent variable. For example, a one-sample t-test compares the mean of a single group to a known value.
- Multi-variable analysis involves analyzing relationships or interactions among multiple variables. For instance, multiple regression examines how several independent variables (e.g., age, income, and education level) predict an outcome (e.g., job satisfaction).
You must also consider how variables interact. For instance, when comparing groups, you may use a t-test (for two groups) or ANOVA (for more than two groups). On the other hand, examining relationships might involve correlation or regression.
By understanding the number and role of variables in your study, you can select tests that capture the complexity of your research, providing a thorough and nuanced analysis of your data.
Sample Size Considerations
Sample size is a critical factor in choosing the right statistical test. The size of your sample affects the power of your analysis, which is the ability to detect significant effects when they exist.
Small sample sizes often lead to underpowered tests, increasing the likelihood of Type II errors (failing to detect a true effect). In such cases, you may need to use non-parametric tests, which are less sensitive to sample size but can still provide reliable results. Conversely, larger samples generally yield more robust and reliable results, allowing for the use of parametric tests like t-tests or regression analysis.
Power analysis is a valuable tool for determining the minimum sample size required for meaningful results. It considers factors like the expected effect size, significance level, and desired power (typically 80%). By conducting a power analysis during the planning phase, you can ensure your study has an adequate sample size for valid results.
However, ignoring sample size considerations can compromise your findings and weaken the impact of your research. Thus, planning for an appropriate sample size is essential for choosing the right statistical test and achieving reliable outcomes.
Common Statistical Tests and When to Use Them
Navigating the world of statistical tests can feel overwhelming, especially with so many options. Each test has a specific purpose and is suited to certain types of data and research questions. Choosing the wrong test can lead to invalid results, but with a clear understanding of the most common statistical tests, you can make informed decisions. Here, we break down some of the most widely used tests in dissertation research and explain when to use them.
Descriptive Statistics
Descriptive statistics summarize and organize your data to provide an overall picture of your dataset. They include measures like the mean, median, mode, standard deviation, and range. These statistics do not infer relationships or differences but offer valuable insights into the structure and central tendencies of your data.
For example:
- Mean gives the average of your dataset, providing a quick sense of central tendency.
- The median is useful when your data contains outliers, as it shows the middle value without being influenced by extreme scores.
- Standard deviation reveals how spread out the values are, helping you understand data variability.
Descriptive statistics are typically used in the preliminary stages of data analysis to summarize your findings before conducting inferential tests. For instance, before comparing group means, you might report descriptive statistics to highlight differences in central tendencies and dispersion.
Using descriptive statistics ensures a clear presentation of your data, allowing readers to grasp the basic characteristics of your dataset. They are an essential step in understanding your data and setting the stage for more advanced analyses.
Comparing Groups
When your research involves comparing groups, specific tests can determine if differences are statistically significant. Some of these statistical tests include:
- Independent Samples t-Test: This test compares the means of two independent groups. For example, you could use it to compare male and female test scores. Assumptions include normal distribution and homogeneity of variances.
- Paired t-Test: Used when comparing the same group at two time points, such as before and after an intervention. This test accounts for the dependency between measurements, making it ideal for pretest-posttest designs.
- ANOVA (Analysis of Variance): This test compares the means of more than two groups. For instance, you might use ANOVA to compare test scores among students in three different teaching methods. Post hoc tests can identify specific group differences if the ANOVA result is significant.
Each of these tests is suitable for different scenarios, and understanding their distinctions ensures you use the right one for your research. However, misusing these tests can lead to incorrect interpretations and weaken the validity of your findings.
Testing Relationships
When your research focuses on understanding relationships between variables, correlation and regression analyses are commonly used.
- Correlation Analysis: This test assesses the strength and direction of the relationship between two continuous variables. For example, it can reveal whether hours of study are positively associated with exam performance. Correlation coefficients range from -1 to 1, with values closer to 1 or -1 indicating strong relationships.
- Regression Analysis: This test predicts an outcome variable (dependent) based on one or more predictors (independent variables). For example, you might use regression to predict job satisfaction based on work hours and salary. Multiple regression extends this approach by including multiple predictors.
Both tests help researchers understand relationships, but they differ in purpose. Correlation identifies associations, while regression predicts outcomes. Choosing between them depends on your research questions and goals.
Categorical Data Analysis
Analyzing categorical data requires specific tests to account for its nature.
- Chi-Square Test: This test evaluates relationships between categorical variables. For instance, it can assess whether gender influences voting preferences. The test compares observed and expected frequencies in contingency tables.
- Fisher’s Exact Test: This is suitable for small sample sizes. It is used when chi-square assumptions are violated. For example, it can determine if a new treatment’s success rate differs between two small groups.
Both tests are indispensable for analyzing categorical data, ensuring the relationships you identify are statistically significant. However, misapplying these tests to continuous data or ignoring assumptions can lead to invalid conclusions.
Non-Parametric Tests
Non-parametric tests are invaluable when data doesn’t meet parametric test assumptions, such as normality or equal variances. Some of the most common non-parametric tests include:
- Mann-Whitney U Test: Compares two independent groups when the data is ordinal or non-normal. For example, it could be used to compare satisfaction levels between two customer groups.
- Kruskal-Wallis Test: Extends the Mann-Whitney U Test to compare more than two groups. It’s useful in scenarios like comparing employee satisfaction across three departments.
- Wilcoxon Signed-Rank Test: An alternative to the paired t-test, this test compares paired observations, such as pretest and posttest scores, when normality assumptions aren’t met.
Non-parametric tests provide robust alternatives to parametric methods, ensuring reliable results even when data violates strict assumptions. They are particularly useful in studies with small sample sizes or non-normal data distributions.
Step-by-Step Guide to Choosing the Right Statistical Test
Choosing the right statistical test is a critical step in ensuring the validity and reliability of your dissertation research. With countless tests available, the process may seem overwhelming at first. However, breaking it down into manageable steps can simplify the task and help you make an informed decision. This section walks you through a step-by-step guide to confidently select the best statistical test for your study.
Step 1: Identify Your Research Question and Hypothesis
Your research question and hypothesis serve as the foundation for choosing the correct statistical test. Begin by clearly defining what you want to investigate. Are you exploring relationships, comparing groups, or analyzing frequencies?
For instance:
- If your question is about comparing exam scores between two teaching methods, you might need a t-test or ANOVA.
- If you’re exploring the relationship between study hours and performance, correlation or regression would be appropriate.
Your hypothesis, whether it’s directional (e.g., Group A will score higher than Group B) or non-directional (e.g., There is a difference between Group A and Group B), will also influence your choice of test. A clear research question and hypothesis streamline the decision-making process by aligning your test with your study’s goals.
Understand Your Data Types
The type of data you’re working with significantly impacts your choice of statistical test. Data is commonly categorized as nominal, ordinal, interval, or ratio.
- Nominal Data: Categories without order (e.g., gender, marital status). Tests like chi-square or Fisher’s exact test are often used.
- Ordinal Data: Ranked categories (e.g., satisfaction levels from 1 to 5). Non-parametric tests like Mann-Whitney U or Kruskal-Wallis are suitable.
- Interval and Ratio Data: Numerical data with meaningful intervals (e.g., temperature, income). Parametric tests like t-tests and regression are typically applied.
Correctly identifying your data type ensures you don’t misuse a test designed for another data category. For example, using a t-test on ordinal data might invalidate your results.
Step 3: Determine the Number of Groups or Variables
The complexity of your study is influenced by the number of groups or variables you’re analyzing.
- Single Variable: If you’re summarizing a single variable, descriptive statistics like mean or standard deviation may suffice.
- Two Groups: To compare two groups (e.g., males vs. females), tests like independent t-tests or Mann-Whitney U are ideal.
- More Than Two Groups: When comparing three or more groups, consider ANOVA or Kruskal-Wallis.
- Multiple Variables: If your study involves several variables, advanced tests like regression, factor analysis, or multivariate analysis of variance (MANOVA) might be necessary.
Understanding the structure of your data helps you narrow down test options and ensures you choose one capable of handling the complexity of your study.
Step 4: Assess Your Sample Size
Sample size plays a crucial role in statistical testing, as it affects the power and reliability of your results.
- Small Sample Sizes: For smaller samples, non-parametric tests like Mann-Whitney U or Fisher’s exact test are more appropriate since they don’t rely on normality assumptions.
- Large Sample Sizes: Parametric tests like t-tests, ANOVA, and regression are often preferred, as their results are robust with larger samples.
Additionally, consider conducting a power analysis to ensure your sample size is sufficient to detect meaningful effects. A small sample may lead to false negatives, while an excessively large sample can detect trivial differences.
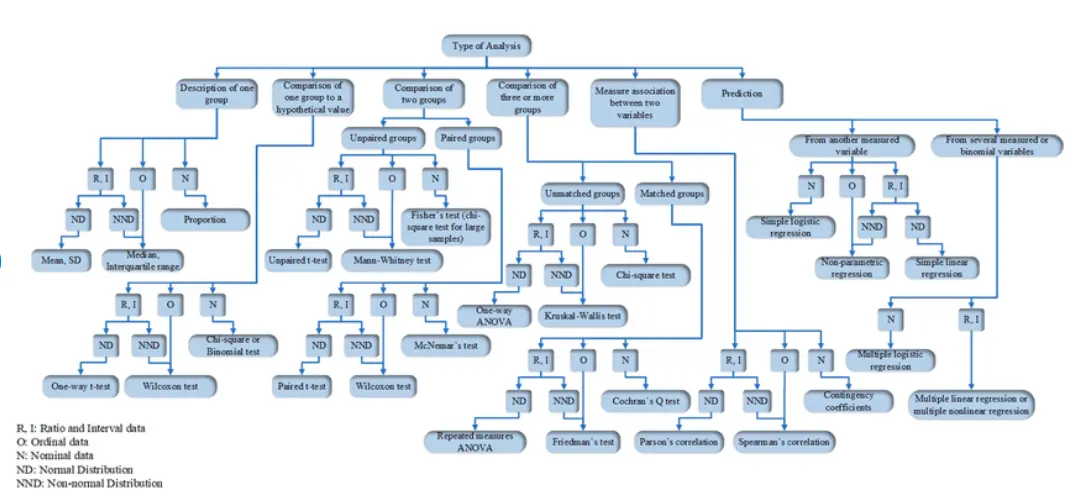
Step 5: Use a Decision Tree or Statistical Test Selection Chart
To simplify the process, a decision tree or statistical test selection chart can be a helpful tool. Here’s a simplified flowchart to guide you:
- What is your research goal?
- To compare groups → Proceed to (2).
- To test relationships → Proceed to (3).
- How many groups?
- Two groups → Use t-test or Mann-Whitney U.
- More than two groups → Use ANOVA or Kruskal-Wallis.
- What type of variables?
- Categorical variables → Use chi-square or Fisher’s exact test.
- Continuous variables → Use correlation or regression.
Visual aids like decision trees not only simplify the process but also minimize errors in test selection. By following these steps, you can confidently choose the right statistical test, ensuring your dissertation results are both accurate and credible.
Common Mistakes to Avoid When Choosing Statistical Tests for Your Dissertation
Choosing and applying statistical tests can be tricky, especially for students unfamiliar with statistical principles. Making errors in this process can lead to invalid conclusions and undermine your entire research. Thus, being aware of common mistakes can help you avoid them and ensure your results are credible.
One of the most frequent mistakes is overlooking data assumptions. Many statistical tests, like t-tests and ANOVA, assume normality (data should follow a normal distribution) and homogeneity of variance (variances across groups should be similar). Ignoring these assumptions can distort your results. For instance, applying a parametric test to non-normal data may yield misleading outcomes. Thus, you should always check these assumptions using tools like histograms, the Shapiro-Wilk test, or Levene’s test before running your analysis.
Another common pitfall is misinterpreting test results. Statistical significance (p-values) does not always mean practical importance. A result may be statistically significant but not meaningful for your study. Similarly, failing to report effect sizes or confidence intervals can leave your findings incomplete and less impactful.
Lastly, using the wrong test for your data type or research question is a critical error. Applying a chi-square test to continuous data or using a t-test when comparing more than two groups can lead to invalid results. Always align the test with your research question, data type, and study design.
By avoiding these mistakes, you ensure that your statistical analysis supports your dissertation with accurate and reliable conclusions.
Key Takeaways
- Understand Your Data and Objectives
Choosing the right statistical test begins with understanding your data type (nominal, ordinal, interval, or ratio) and aligning it with your research questions and hypotheses. Properly identifying these factors ensures that the test you select is appropriate for your study. - Study Design and Variables Matter
The design of your study (experimental or observational) and the number of variables (single or multiple) play a critical role in test selection. These elements dictate whether to use simple tests like t-tests or advanced methods like regression or ANOVA. - Check Data Assumptions
Before applying any statistical test, ensure your data meets the necessary assumptions such as normality and homogeneity of variance. Ignoring these assumptions can result in invalid or misleading results. - Choose Tests Based on Research Goals
Different tests serve different purposes. Use descriptive statistics for summarizing data, t-tests and ANOVA for comparing groups, and correlation or regression for analyzing relationships. Understanding the purpose of each test helps avoid misuse. - Avoid Common Mistakes
Mistakes like misinterpreting statistical significance, ignoring effect sizes, and selecting the wrong test for your data type or research question can undermine your research. Following a structured step-by-step approach helps prevent these errors.
FAQs
Choosing the correct statistical test ensures that your research findings are valid and reliable. The wrong test can lead to inaccurate conclusions, potentially compromising the integrity of your dissertation. By selecting the right test, you ensure that your analysis is aligned with your research question and data type.
The right test depends on several factors, including your research question, data type (nominal, ordinal, interval, ratio), study design, number of variables, and sample size. Following a step-by-step approach to analyze these elements will guide you to the appropriate test for your data.
Yes, we specialize in dissertation data analysis and can assist you with selecting the most appropriate statistical test for your study. Our experts work closely with you to understand your research objectives and data to ensure the test you use supports your findings.
If your data doesn’t meet the assumptions required for a test, we can guide you on how to transform your data or suggest appropriate non-parametric tests that don’t rely on these assumptions. We ensure that your analysis remains valid, even with complex data.
Yes, reporting effect sizes and confidence intervals is crucial. While p-values indicate statistical significance, effect sizes show the magnitude of an effect, and confidence intervals provide a range of values within which the true effect is likely to fall. This ensures a comprehensive understanding of your results.
Getting started is simple! Reach out to us via our contact page, and one of our experts will be in touch to discuss your dissertation and how we can assist with your data analysis needs. We provide dissertation data analysis support to ensure the success of your research.

