A one-sample t-test is used to compare the mean of a sample to a known or hypothesized value. It helps determine whether the observed difference is statistically significant or due to chance. Reporting results in APA style is important because it ensures clarity, consistency, and credibility in academic writing. Many students struggle with how to present statistical findings correctly, especially when using outputs from tools like SPSS. In this guide, you will learn how to report a one-sample t-test in APA style, including the correct format, key components to include, and how to interpret and write your results clearly, with practical examples.
What is a One-Sample T-Test?
A one-sample t-test compares the mean of a sample to a known or hypothesized value. You use it when you want to test whether your sample mean is significantly different from a specific benchmark. For example, a researcher may test whether the average test score of students differs from a national average of 70.
What You Need Before Reporting Results
Before you write your results in APA style, make sure you have all the key values ready. Many students make mistakes because they start writing without checking their output carefully. If you miss even one value, your report may be incomplete or incorrect. Take a moment to gather everything first, so your write-up is clear and accurate.
Checklist:
- Sample mean (M)
- Standard deviation (SD)
- Test value (μ₀)
- t-value (t)
- Degrees of freedom (df)
- p-value (p)
- Confidence interval (optional but recommended)
APA Format for Reporting a One-Sample T-Test
A clear APA write-up should report the test, the comparison value, the sample statistics, the test statistic, the p-value, and, where appropriate, the confidence interval and effect size. This gives the reader enough information to understand both the result and its practical meaning.
Standard APA Reporting Structure
You can use this template:
A one-sample t-test was conducted to compare [variable] to [test value]. The results showed that the mean (M = [sample mean], SD = [standard deviation]) was [significantly higher than / significantly lower than / not significantly different from] [test value], t ([df]) = [t-value], p = [p-value], 95% CI [[lower bound], [upper bound]], d = [effect size].
This structure includes the main parts of an APA-style report:
- M = the sample mean
- SD = the standard deviation
- t = the t-test statistic
- df = the degrees of freedom
- p = the significance value
- 95% CI = the confidence interval for the mean difference
- d = the effect size, usually Cohen’s d
You can adjust the wording depending on the result. If the mean is above the test value, say it was significantly higher than the test value. Otherwise, say significantly lower than. Additionally, if the result is not significant, say not significantly different from the test value.
Key APA Formatting Rules
Follow these basic APA rules to ensure your results are clear and consistent:
- Italicize statistical symbols. Write t and p in italics (e.g., t(29) = 2.45, p = .021).
- Round values correctly
- Round the t-value to two decimal places
- Round the p-value to three decimal places
- Report very small p-values properly. If the p-value is very small, write p < .001 instead of the exact value.
- State the direction of the result. Clearly indicate whether the mean is higher than, lower than, or not different from the test value.
Reporting One-Sample T-Test Results in APA: Step-by-Step
Many students struggle to move from SPSS output to a clean APA report. The best way to learn is to follow a clear sequence. In this section, you will first see the exact steps, then a simple example, the key output values, and finally, how to write the result in APA style.
Follow these steps when reporting a one-sample t-test in APA:
- Step 1: State the test and purpose. Start by naming the test and what you are comparing. For example: A one-sample t-test was conducted to compare [variable] to [test value]. This tells the reader what analysis you performed and what you tested.
- Step 2: Report the sample statistics. Include the mean and standard deviation from your output (e.g., SPSS). Write them as (M = value, SD = value). Make sure you italicize M and SD. These values describe your sample.
- Step 3: Determine the direction of the result. Compare the sample mean (M) to the test value. If the mean is higher, say “significantly higher than.” If it is lower, say “significantly lower than.” If the result is not significant, say “not significantly different from.” This shows the meaning of your result.
- Step 4: Report the test statistics. Include the t-value, degrees of freedom, and p-value from your output. Write them as t(df) = value, p = value. Make sure t and p are italicized, and values are rounded correctly. This shows the statistical evidence.
- Step 5: Combine everything into one sentence. Put all the parts together into one clear APA-style sentence. This is your final reported result.
Example 1. Significant Results
A researcher wants to test whether the average test score of students differs from a benchmark score of 70. A sample of 30 students is analyzed using a one-sample t-test in SPSS. The following results were obtained:
- Mean (M) = 74.20
- Standard deviation (SD) = 8.50
- t-value = 3.12
- Degrees of freedom (df) = 29
- p-value = .004
Task: Write a complete APA-style report for these results.
Solution
Let’s apply the reporting steps:
- Step 1: State the test and purpose. A one-sample t-test was conducted to compare students’ average test scores to the benchmark value of 70.
- Step 2: Report the sample statistics. The mean score was (M = 74.20, SD = 8.50).
- Step 3: Determine the direction of the result. The mean score (74.20) is higher than the benchmark value (70), and the p-value (.004) is less than .05, so the result is statistically significant. Therefore, the mean is significantly higher than 70.
- Step 4: Report the test statistics. t(29) = 3.12, p = .004.
- Step 5: Combine everything into one sentence.
Final APA Report. A one-sample t-test was conducted to determine whether students’ average test score differed from the benchmark score of 70. The results showed that the mean score (M = 74.20, SD = 8.50) was significantly higher than 70, t(29) = 3.12, p = .004.
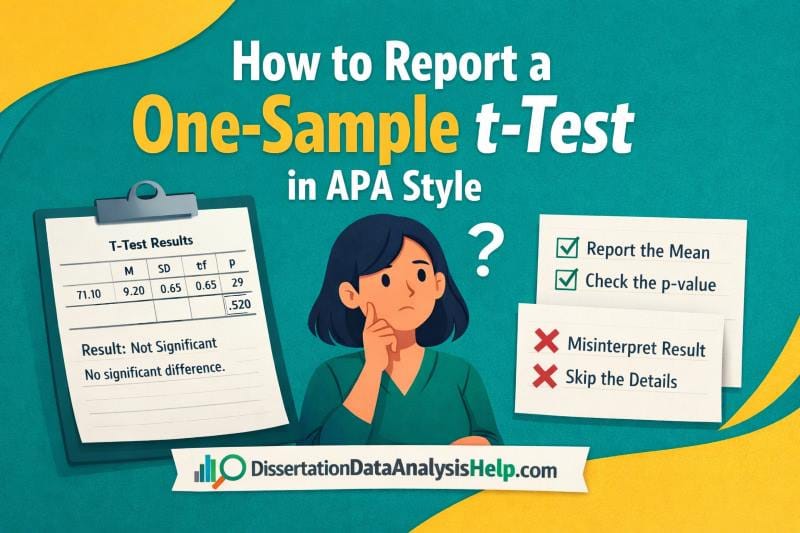
Example 2. (Non-Significant Result)
A researcher wants to test whether the average test score of students differs from a benchmark score of 70. A sample of 30 students is analyzed using a one-sample t-test in SPSS. The following results were obtained:
- Mean (M) = 71.10
- Standard deviation (SD) = 9.20
- t-value = 0.65
- Degrees of freedom (df) = 29
- p-value = .520
Task: Write a complete APA-style report for these results.
Solution
Let’s apply the reporting steps:
- Step 1: State the test and purpose. A one-sample t-test was conducted to compare students’ average test scores to the benchmark value of 70.
- Step 2: Report the sample statistics. The mean score was (M = 71.10, SD = 9.20).
- Step 3: Determine the direction of the result. The mean score (71.10) is slightly higher than 70. However, the p-value (.520) is greater than .05, so the result is not statistically significant. Therefore, the mean is not significantly different from 70.
- Step 4: Report the test statistics. t(29) = 0.65, p = .520.
- Step 5: Combine everything into one sentence.
Final APA Report: A one-sample t-test was conducted to determine whether students’ average test score differed from the benchmark score of 70. The results showed that the mean score (M = 71.10, SD = 9.20) was not significantly different from 70, t(29) = 0.65, p = .520.
How to Interpret One-Sample T-Test Results
After running a one-sample t-test, the next step is to understand what the results mean. Many students can report the values but struggle to interpret them correctly. Follow these simple steps to interpret your results clearly and accurately.
Step-by-Step Interpretation
- Step 1: Check the p-value (significance). Look at the p-value in your output. If p < .05, the result is statistically significant. This means the sample mean is different from the test value. If p ≥ .05, the result is not significant, and there is no strong evidence of a difference.
- Step 2: Compare the mean to the test value. Look at the sample mean (M) and compare it to the test value (μ₀). This helps you understand whether the sample is above or below the benchmark.
- Step 3: Determine the direction of the result. If the mean is greater than the test value, the result is higher. If it is smaller, the result is lower. If the test is not significant, you should not claim a difference.
- Step 4: State the conclusion in plain language. Write a simple sentence that explains the result without statistics. Focus on what the finding means in context.
Example
Suppose the sample mean is 74.20, the test value is 70, and p = .004.
- The p-value (.004) is less than .05, so the result is significant.
- The mean (74.20) is higher than 70.
Therefore, the interpretation is that students scored significantly higher than the benchmark score of 70.
How to Report One-Sample T-Test Results in APA Tables
In most cases, you can report a one-sample t-test in a sentence. However, tables are useful when you want to present results for multiple variables or make your findings easier to compare. Tables also improve clarity in longer reports such as dissertations or research papers.
When you use a table, keep it simple and follow APA style. Include only the key statistics and label everything clearly.
Simple APA Table Format
| Variable | M | SD | t | df | p |
|---|---|---|---|---|---|
| Test Score | 74.20 | 8.50 | 3.12 | 29 | .004 |
Tips:
- Use clear variable names
- Round values correctly (t to 2 decimals, p to 3 decimals)
- Do not overcrowd the table with unnecessary information
You can still include a short sentence below the table to highlight the main finding if needed.
Common Mistakes to Avoid
Even when your calculations are correct, small reporting mistakes can reduce the quality of your work. Avoid these common errors when writing a one-sample t-test in APA style:
- Not reporting degrees of freedom (df). Always include df in your report (e.g., t(29) = 2.45). This is a required part of APA reporting.
- Incorrect p-value formatting. Do not write p = 0.004. APA style requires p = .004. Also, write p < .001 when the value is very small.
- Missing mean or standard deviation. You must report both the mean (M) and standard deviation (SD). These values describe your data and are essential.
- Copy-pasting SPSS output directly. Do not paste raw SPSS tables into your report. Always convert the output into a clear APA-style sentence or table.
- Not stating the direction of the difference. Do not just say the result is significant. Clearly state whether the mean is higher than, lower than, or not different from the test value.
Conclusion
Reporting a one-sample t-test in APA style becomes much easier when you follow a clear structure. You need to state the test, report the key statistics, and explain the result in a simple and accurate way. Always include the mean, standard deviation, t-value, degrees of freedom, and p-value, and make sure your formatting follows APA guidelines.
More importantly, focus on clarity. Do not just report numbers—show what they mean. When you practice these steps, you will be able to turn any SPSS output into a clean, professional APA report with confidence.
Need Help Reporting Your Results?
Struggling to write your dissertation results section or report your SPSS output in APA style? You’re not alone. Many students find it hard to interpret results and present them clearly, even after running the correct analysis.
At DissertationDataAnalysisHelp.com, we provide expert dissertation results section help to guide you through interpretation, APA reporting, and clear academic writing. We ensure your results are accurate, well-structured, and easy to understand.