Cronbach’s alpha is one of the most popular statistics used to check the reliability of a questionnaire or test. It tells us how well a set of items or questions works together to measure the same idea or concept. When a scale has high internal consistency, it means the items are strongly related and give consistent results. This makes your data more trustworthy and your conclusions more accurate. Researchers, students, psychologists, and educators often use Cronbach’s alpha when developing surveys or assessment tools. Understanding Cronbach’s alpha helps you evaluate and improve your measurement instruments. In this article, we will explore what it is, how to calculate it, how to interpret it, and alternative tests for reliability testing.
Definition
Cronbach’s alpha is a statistic used to measure the internal consistency of a set of items, which means it checks how well a group of questions work together to measure the same concept. In simple words, it shows whether the items on a test or questionnaire are reliable as a group. Cronbach’s alpha is one of the most common and widely used methods in research to test the reliability of items in a scale.
This measure was introduced by Lee J. Cronbach in 1951 to help researchers evaluate if their measurement tools were consistent. Before this, there was no standard way to check if survey or test items truly belonged together. His work provided a clear and practical method to assess reliability, which is why it quickly became popular in psychology, education, and social sciences.
Researchers, students, psychologists, and educators use Cronbach’s alpha when they create or evaluate surveys, questionnaires, or tests. It is especially important when all items are meant to measure one single concept, known as a unidimensional scale. By using Cronbach’s alpha, you can make sure your items give consistent and dependable results.
Why is Cronbach’s Alpha Important?
Cronbach’s alpha is important because it helps researchers check the reliability of scales and questionnaires. When you create a survey or test, you want to make sure all the items measure the same idea and work well together. A high Cronbach’s alpha value means the items are consistent and the results are more dependable. This is important because reliable data leads to more accurate findings and stronger conclusions. Without checking reliability, your study results might be misleading or invalid.
Cronbach’s alpha is widely used in different fields. In psychology, it is used to test if questions on a depression or anxiety scale truly measure those feelings. In education, it helps check if exam questions accurately measure student understanding of a topic. It is also common in healthcare research to test patient satisfaction surveys and quality of life scales. By using Cronbach’s alpha, researchers can improve their tools and make sure they are collecting high-quality data.
How to Calculate Cronbach’s Alpha
Cronbach’s alpha is a statistical coefficient used to evaluate how well a set of items measures a single unidimensional construct. It is one of the most widely used methods for assessing the internal consistency or reliability of a scale in research.
The formula for Cronbach’s alpha is as follows:

Where:
- N is the number of items (questions) on your scale.
- c̄ is the average covariance between item pairs.
- v̄ is the average variance of each item.
In simple words, the formula compares how much each item agrees with the others (covariance) to how much each item varies on its own (variance). A higher alpha means the items are more consistent together.
Example:
Imagine you have a 3-item scale measuring study motivation, where each of these items is measured using a 5-point Likert scale. After collecting responses, you find:
- Average variance (v̄ ) = 0.8
- Average covariance (c̄ ) = 0.5
- Number of items (N) = 3
Plugging these into the formula, we have:
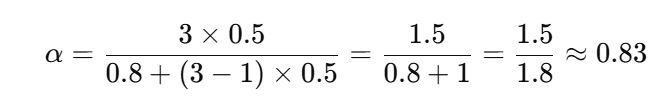
An alpha of 0.83 suggests good internal consistency. However, you do not need to calculate this by hand. Most researchers use software like SPSS to get Cronbach’s alpha easily. You can follow this step-by-step guide on how to compute Cronbach’s alpha in SPSS.
Interpreting Cronbach’s Alpha Values
Once you calculate Cronbach’s alpha, the next important step is to interpret its value. Cronbach’s alpha ranges from 0 to 1. A higher value means the items in your scale are more consistent in measuring the same concept. However, there is no single “perfect” cutoff point that works for every study. The acceptable value depends on your research area and purpose. In most cases, a commonly acceptable alpha value is at least 0.7.
Here is a general guide to interpreting different ranges of Cronbach’s alpha values:
| Alpha Value | Interpretation |
|---|---|
| ≥ 0.90 | Excellent (may suggest redundancy if too high) |
| 0.80 – 0.89 | Good |
| 0.70 – 0.79 | Acceptable |
| 0.60 – 0.69 | Questionable |
| 0.50 – 0.59 | Poor |
| < 0.50 | Unacceptable |
A value above 0.9 is considered excellent, but it can sometimes mean that some items are too similar or redundant. Values between 0.8 and 0.9 are generally seen as good and indicate strong internal consistency. Values between 0.7 and 0.8 are acceptable in most social science research. If the value is between 0.6 and 0.7, it might be acceptable in exploratory research, but it suggests that you should consider reviewing or improving the items. Values below 0.6 usually mean the scale is not reliable enough and needs revision.
However, it is important to remember that a high alpha value does not guarantee that your scale measures only one concept (unidimensionality). It simply shows that the items are related. You should always look at item-total correlations and perform further analyses, such as factor analysis, to confirm that all items measure the same underlying construct.
Alternatives to Cronbach’s Alpha
While Cronbach’s alpha is a popular and widely used measure of reliability, it is not the only option. In fact, relying only on alpha can sometimes give an incomplete picture of how reliable your scale really is. Researchers often use other methods to confirm and strengthen their assessment of reliability. These include:
- Split-half reliability – In this method, a scale is divided into two equal halves (for example, odd and even items). The correlation between the two halves is then calculated. If the two halves produce similar results, the scale is considered reliable.
- McDonald’s Omega – It is considered a more accurate measure of internal consistency, especially when the assumption that all items contribute equally (as assumed by Cronbach’s alpha) does not hold. Omega takes into account the strength of each item’s relationship to the overall factor, making it a better choice when items vary in how strongly they measure the main concept.
- Test-retest reliability – This measures the stability of a scale over time. In this method, the same test is given to the same group of people at two different points in time. A high correlation between the two sets of scores means the scale is stable and reliable over time. This approach is very useful when you want to ensure that your instrument produces consistent results across different occasions.
- Composite reliability – This is often used in structural equation modeling and when dealing with latent variables. It considers the loadings of each item and provides a more precise estimate of internal consistency. Composite reliability is especially valuable when items have different levels of importance or when a more refined reliability measure is needed beyond what alpha provides.
Conclusion
Cronbach’s alpha is one of the most widely used methods for checking the reliability of scales and questionnaires in research. It helps you understand whether your items work well together to measure a single concept, making your data more trustworthy and your results stronger. While interpreting alpha values, it is important to follow general guidelines, but also consider the context of your study.
However, Cronbach’s alpha is not the only tool you should rely on. Exploring other reliability measures, such as split-half reliability, McDonald’s Omega, test-retest reliability, and composite reliability, can give you a deeper and more complete understanding of your scale’s performance. By learning how to calculate, interpret, and compare different reliability measures, you can create better research instruments and make more confident conclusions. Taking time to check and improve the reliability of your tools is a crucial step toward producing high-quality, impactful research.
Need Help Computing Cronbach’s Alpha for Your Survey?
Computing Cronbach’s alpha and interpreting reliability results can be challenging, especially if you are working with large surveys or complex questionnaires. Making sure your items are consistent and your data is reliable is key to producing strong research findings. If you need support with this process, our survey data analysis services can help.
At DissertationDataAnalysisHelp, we assist with computing Cronbach’s alpha, improving your scales, analyzing survey data, and providing clear, detailed interpretations. Our team works with students, researchers, and professionals to ensure their surveys are accurate and impactful.