Cohen’s d Effect Size Calculator and Formula

Cohen’s d is one of the most widely used measures of effect size in research. In simple terms, it tells you how big the difference is between two group means in relation to their standard deviation. Instead of just knowing if a result is statistically significant, Cohen’s d helps you understand whether the difference is small, medium, or large in practical terms. This makes it especially valuable in dissertations, theses, and academic research, where interpretation matters just as much as the numbers. Our Cohen’s d calculator is designed to save you time by quickly applying the Cohen’s d formula and giving you both the value and an easy-to-follow interpretation.
Use the interactive Cohen’s d calculator below to quickly measure the effect size between two groups. Simply enter the group means, standard deviations, and sample sizes, and the calculator will instantly apply the Cohen’s d formula. You’ll not only get the effect size value but also an interpretation of whether it’s small, medium, or large. This makes it easy to understand the practical significance of your findings without doing manual calculations.
Looking to compute several effect sizes in one place? Try our All-in-One Effect Size Calculator, which supports Cohen’s d, Hedges’ g, Eta Squared, Partial Eta Squared, Odds Ratio, and Cramér’s V for all your research needs.
Cohen’s d is a type of effect size that shows how much difference exists between two groups in terms of standard deviation units. While a p-value can tell you whether a result is statistically significant, it does not explain the strength or importance of the difference. This is where Cohen’s d effect size becomes useful, as it helps researchers understand whether the observed difference is small, moderate, or large in practical terms. By focusing on Cohen’s d interpretation, you can go beyond significance testing and communicate the real-world impact of your findings, which is especially valuable in dissertations, theses, and applied research studies.
The Cohen’s d formula quantifies the standardized mean difference between two groups. The Cohen’s d formula is given by:
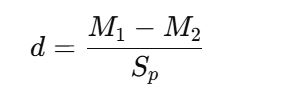
Where:
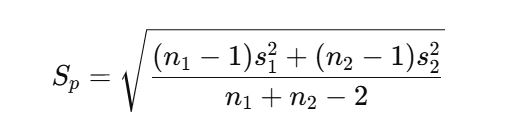
For unequal group sizes (n1 ≠ n2), the pooled standard deviation, Sp is computed using the following formula:
However, if the sample sizes for the two groups are equal, the pooled standard deviation, Sp is computed using the formula:
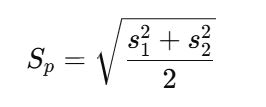
In both cases, s1and s2 are the sample Standard deviations, while n1and n2 are the groups’ sample sizes. The sign of d indicates the direction of the difference. In other words, it indicates which group had a significantly and practically greater mean than the other.
Need help calculating, interpreting your results or reporting cohen’s d in your dissertation? Hire a data analyst now
Imagine you are comparing two groups of students: one group received extra tutoring in statistics, while the other did not. After the semester, you want to know not just if the tutoring made a difference, but how big that difference really is. This is where Cohen’s d comes in. By calculating the effect size, you can measure the practical impact of tutoring on student performance. Below is a simple example that shows how to calculate Cohen’s d step by step.
When you calculate Cohen’s d, the next question is always the same: what does this number actually mean? A p-value can tell you if there is a difference, but it cannot tell you if the difference is small or important. This is why Cohen’s d interpretation is such a powerful tool. It helps you move from “statistically significant” to “practically meaningful.”
Cohen (1988) suggested three conventional thresholds for effect size interpretation:
It is also important to note that the interpretation of Cohen’s d statistic can vary by discipline. In psychology and education, a d = 0.5 may be considered very meaningful. However, in medicine or clinical research, researchers often look for larger effect sizes before calling a treatment impactful. Therefore, you should always interpret Cohen’s d within the context of your research field, sample size, and study design.
When writing a dissertation, it is not enough to only report whether your results are statistically significant. Many universities and journals now require students and researchers to also report effect sizes. This is because effect sizes, such as Cohen’s d, show how meaningful your findings are in real terms. Adding Cohen’s d to your dissertation strengthens your work and shows that you understand the importance of practical impact, not just significance testing.
If you are following APA guidelines, it is important to know how to report Cohen’s d in APA style. The APA recommends that effect sizes be included whenever statistical tests are reported. This usually means reporting the value of Cohen’s d directly after the test results. For example: “The treatment group scored significantly higher than the control group, t(48) = 2.45, p = .018, d = 0.71.” In this sentence, Cohen’s d value gives the reader a clear picture of the effect size.
By including Cohen’s d in your dissertation, you provide a fuller picture of your results. Readers, examiners, and future researchers can better understand the strength of your findings. Whether you are in psychology, education, medicine, or social sciences, reporting Cohen’s d in APA format makes your dissertation more professional and easier to compare with other studies.
Cohen’s d is a measure of effect size. It tells you how big the difference is between two group means in terms of standard deviations.
You subtract one group’s mean from the other, then divide the difference by the pooled standard deviation. You can use our Cohen’s d calculator to do the math quickly.
According to Cohen’s (1988) guidelines, 0.2 is a small effect, 0.5 is a medium effect, and 0.8 is a large effect. But remember, the interpretation may differ by discipline.
Reporting Cohen’s d shows the practical importance of your findings, not just statistical significance. Many universities and journals require reporting effect sizes like Cohen’s d.
In APA format, report the d value after your test results. Example: “The control group scored lower than the experimental group, t(48) = 2.30, p = .025, d = 0.65.”
No. Cohen’s d is widely used in psychology, education, medicine, and social sciences. Any research comparing two groups can benefit from Cohen’s d calculation.

January 8, 2026
This sample size calculator computes the minimum sample size for your study using Taro Yamane's...
Read More
July 5, 2025
Effect size is a measure that shows how strong a relationship is between variables or...
Read More
June 8, 2025
Determining the right sample size is important in research and surveys. A small sample may...
Read More
April 16, 2025
Instantly calculate the margin of error for your surveys or studies using our free and...
Read More
