Descriptive statistics are often the first results you report in a dissertation, thesis, research paper, or class project. They help readers understand your sample, your variables, and the general pattern of your data before you present deeper statistical tests. However, many students are not sure how to write descriptive statistics in APA style. They may have SPSS or Excel output, but they do not know which values to include, how many decimals to use, or whether the results should appear in text or in a table.
This guide explains how to report descriptive statistics in APA in a simple way. You will learn how to report means, standard deviations, frequencies, percentages, medians, ranges, and descriptive statistics tables. You will also see examples you can adapt for your own results section.
If you already have your output but need help turning it into a clear results chapter, our dissertation results section help can support you with APA-style reporting, interpretation, and clean presentation of findings.
Quick Answer: How Do You Report Descriptive Statistics in APA?
To report descriptive statistics in APA, identify the correct summary statistics for your variable type, present them clearly, and use APA-style symbols where needed. For continuous variables, you often report the mean and standard deviation. For categorical variables, you usually report frequencies and percentages. However, if the data is skewed, you may report the median, range, or interquartile range.
Here are simple examples:
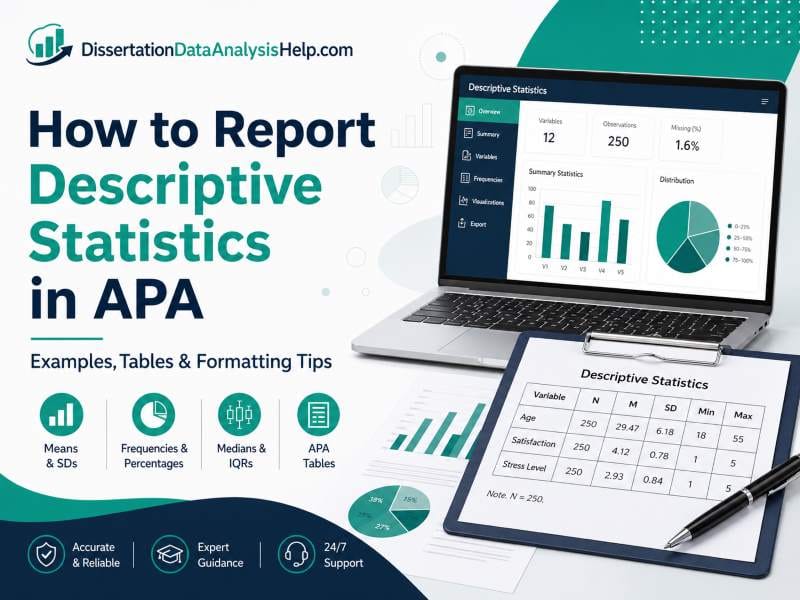
Participants had an average age of 29.48 years (SD = 6.25).
Most participants were female (n = 118, 62.1%).
The median monthly income was $2,850 (IQR = $2,100–$3,600).
You can report descriptive statistics in sentences, tables, or both. Use sentences when you only have a few values. Use a table when you need to summarize several variables, groups, or demographic categories.
The goal is not to copy raw SPSS, Excel, R, or Stata output. The goal is to present the most important values in a clean and readable format.
What Are Descriptive Statistics?
Descriptive statistics summarize data. They show what your data look like without testing a hypothesis. They can describe the sample, the main study variables, or the distribution of responses.
Common descriptive statistics include:
- Mean
- Standard deviation
- Frequency
- Percentage
- Median
- Range
- Minimum and maximum
- Interquartile range
In a dissertation or thesis, descriptive statistics often appear before inferential statistics. For example, you may first describe the sample’s age, gender, education level, and study variables. After that, you may report a t-test, ANOVA, chi-square test, correlation, regression, or other analysis.
Descriptive statistics help readers understand the background of your results. They also make your analysis more transparent. If you need help deciding which descriptive or inferential methods fit your study, you may find our guide on choosing the right statistical test useful.
Why Descriptive Statistics Matter in APA Reporting
Descriptive statistics make your results easier to understand. A statistical test may tell readers whether a difference or relationship is significant. But descriptive statistics show the size, direction, and basic pattern of the data.
For example, saying that two groups are significantly different is not enough. Readers also need to know the mean and standard deviation for each group. This helps them understand which group scored higher and how much variation existed within each group.
Descriptive statistics are also important because they help readers assess whether your data make sense. If a mean, standard deviation, or percentage looks unusual, it may suggest a coding issue, a missing data problem, or an outlier.
In APA-style writing, descriptive statistics should be clear, concise, and relevant. You should not report every number produced by your software. Instead, report the statistics that help answer your research questions and describe your data accurately.
What Descriptive Statistics Should You Report?
The descriptive statistics you report depend on the type of variable. A continuous variable is not reported the same way as a categorical variable. A normally distributed variable is also not always reported the same way as a skewed variable.
| Type of Variable | Descriptive Statistics to Report |
|---|---|
| Continuous variable | Mean and standard deviation |
| Skewed continuous variable | Median, range, or interquartile range |
| Categorical variable | Frequency and percentage |
| Demographic variable | Frequency, percentage, mean, SD, or range |
| Likert scale composite score | Mean and standard deviation |
| Grouped data | Sample size, mean, and standard deviation for each group |
For example, age is usually summarized using a mean and standard deviation. Gender, employment status, and education level are usually summarized using frequencies and percentages. Income may be better summarized using the median and interquartile range if the values are highly skewed.
Always choose statistics that match the measurement level and purpose of your analysis.
APA Symbols for Descriptive Statistics
APA-style reporting uses common statistical symbols. These symbols make your results shorter and easier to read. They are often italicized in the text.
| Statistic | APA Symbol or Label |
|---|---|
| Mean | M |
| Standard deviation | SD |
| Sample size | N or n |
| Median | Median |
| Frequency | n or count |
| Percentage | % |
| Minimum | Min |
| Maximum | Max |
| Interquartile range | IQR |
Use N when referring to the total sample size. Use n when referring to a subgroup or category count.
Example:
The total sample included 180 participants (N = 180). Of these, 112 were female (n = 112, 62.2%).
APA reporting should be consistent. Do not use “mean” in one sentence, “average” in another, and M in another without a clear reason. Choose one style and use it consistently.
How to Report Mean and Standard Deviation in APA
The mean and standard deviation are commonly used for continuous variables. The mean shows the average score. The standard deviation shows how spread out the scores are around the mean.
You should usually report the standard deviation whenever you report the mean. The mean alone is not enough because it does not show variation in the data.
Here are simple APA examples:
The average age of participants was 31.42 years (SD = 7.18).
Participants reported moderate academic stress (M = 3.46, SD = 0.82).
The average test score was 76.35 (SD = 8.94).
You can place the mean and standard deviation inside parentheses, especially when the sentence already explains the variable.
Example:
Students reported a high level of satisfaction with the online course (M = 4.12, SD = 0.71).
Avoid repeating the same phrase too often. Instead of writing “The mean was…” in every sentence, vary your wording while keeping the results clear.
How to Report Frequencies and Percentages in APA
Frequencies and percentages are used for categorical variables. These include variables such as gender, marital status, education level, employment status, program type, and response categories.
A frequency shows the number of cases in a category. A percentage shows the proportion of the sample in that category.
Examples:
Of the 190 participants, 116 were female (n = 116, 61.1%) and 74 were male (n = 74, 38.9%).
Most respondents had a bachelor’s degree (n = 82, 43.2%).
Nearly half of the participants were employed full time (n = 96, 48.0%).
When reporting frequencies and percentages, make sure the numbers match. If your percentage is based on valid responses only, state this when missing data exists.
For example:
Among participants who answered the gender item, 116 were female (n = 116, 61.1%).
This is clearer than pretending that no data were missing.
How to Report Median, Range, and Interquartile Range in APA
The median is useful when data are skewed or contain extreme values. The range shows the lowest and highest values. The interquartile range shows the middle spread of the data.
These statistics are often used for income, waiting time, response time, years of experience, and other variables with uneven distributions.
Examples:
The median monthly income was $2,750 (Q1 = $2,000, Q3 = $3,500; IQR = $1,500).
Participants had between 1 and 22 years of teaching experience, with a median of 7 years.
The median response time was 46.30 seconds (IQR = 34.80–61.20).
Do not force every continuous variable into a mean and standard deviation. If the data are very skewed, the median may describe the typical value better than the mean.
In dissertation reporting, this decision should match your methodology and analysis plan. If you are unsure, it may help to review your data distribution before writing the results.
How Many Decimal Places Should You Use?
APA reporting values should be rounded clearly and consistently. In many cases, means and standard deviations are reported to two decimal places. Percentages are often reported to one decimal place. Counts should not have decimals.
Poor example:
The mean score was 4.238576 and the standard deviation was 0.913842.
Better example:
The mean score was 4.24 (SD = 0.91).
Do not use unnecessary precision. Too many decimal places can make your results harder to read. It may also give a false impression that your measurement is more precise than it really is.
Use the same number of decimal places for similar statistics in the same table or paragraph. For example, if you report one mean as 3.42, report the other means in the same section to two decimal places as well.
Consistency makes your APA results look cleaner and more professional.
How to Report Descriptive Statistics in the Results Section
In a dissertation or thesis, descriptive statistics usually appear near the beginning of the results chapter. They help introduce the sample and the main variables before you report hypothesis tests.
A simple structure may look like this:
- Describe the final sample size.
- Report demographic characteristics.
- Report descriptive statistics for key variables.
- Mention missing data if relevant.
- Move to inferential analysis.
Example:
Descriptive statistics were examined to summarize the sample characteristics and main study variables. The final sample included 214 participants. Most participants were female (n = 126, 58.9%), and the average age was 30.74 years (SD = 6.81). The mean job satisfaction score was 3.86 (SD = 0.77), suggesting moderate to high satisfaction among respondents.
Notice that the paragraph is factual. It does not over-interpret the results. It simply tells readers what the data show.
For broader support with quantitative reporting, see our dissertation statistics help service page.
How to Present Descriptive Statistics in an APA Table
Use an APA table when you have many variables, groups, or categories to summarize. A table is better than a long paragraph when the reader needs to compare several values.
A descriptive statistics table should have a table number, a clear title, suitable column labels, and only the statistics needed for the study.
Example:
Table 1
Descriptive Statistics for Main Study Variables
| Variable | N | M | SD | Min | Max |
|---|---|---|---|---|---|
| Academic motivation | 156 | 3.82 | 0.74 | 1.90 | 5.00 |
| Study satisfaction | 156 | 4.11 | 0.68 | 2.20 | 5.00 |
| Stress level | 156 | 2.96 | 0.91 | 1.00 | 5.00 |
After the table, add a short explanation.
Example:
Table 1 presents the descriptive statistics for the main study variables. Participants reported relatively high study satisfaction (M = 4.11, SD = 0.68) and moderate stress levels (M = 2.96, SD = 0.91).
Do not paste raw software output directly into your paper.
APA Table for Demographic Descriptive Statistics
Demographic variables are often reported using frequencies and percentages. These variables may include gender, age group, education level, employment status, year of study, or marital status.
Example:
Table 2
Demographic Characteristics of Participants
| Characteristic | n | % |
|---|---|---|
| Gender | ||
| Female | 116 | 61.1 |
| Male | 74 | 38.9 |
| Education Level | ||
| Diploma | 38 | 20.0 |
| Bachelor’s degree | 82 | 43.2 |
| Master’s degree | 54 | 28.4 |
| Doctoral degree | 16 | 8.4 |
After the table, summarize the key points in text.
Example:
As shown in Table 2, most participants were female (n = 116, 61.1%). The largest education category was bachelor’s degree holders (n = 82, 43.2%).
Do not repeat every value in the table. Mention only the most relevant patterns.
Examples of Descriptive Statistics in APA
Example 1: Reporting Age
Participants had an average age of 28.64 years (SD = 5.91), with ages ranging from 19 to 47 years.
This example reports the mean, standard deviation, and range. It is useful when age is an important sample characteristic.
Example 2: Reporting Gender
The sample included 96 female participants (n = 96, 61.5%) and 60 male participants (n = 60, 38.5%).
This example reports both counts and percentages. This is better than using percentages alone.
Example 3: Reporting Likert Scale Scores
Respondents reported high perceived supervisor support (M = 4.12, SD = 0.76).
This example works well when several Likert items have been combined into a scale score.
Example 4: Reporting Group Descriptives
Students in the intervention group had higher posttest scores (M = 82.35, SD = 7.41) than students in the control group (M = 75.18, SD = 8.62).
This example is useful before reporting a t-test or ANOVA.
How to Report Descriptive Statistics from SPSS in APA
SPSS can generate descriptive statistics quickly, but the output is not usually ready to paste into a dissertation or research paper. You need to extract the important values and write them in APA style.
Continuous variables can be summarized using the Descriptives or Explore procedure. Categorical variables are usually examined using Frequencies. When working with survey data, you may also need to check missing values, recode variables, and compute scale scores before reporting the final results.
A simple workflow is:
- Run the correct SPSS procedure.
- Identify the relevant values.
- Round the results consistently.
- Decide whether to use text or a table.
- Write the result in clear APA style.
Example from SPSS output:
Participants reported moderate anxiety symptoms (M = 2.84, SD = 0.69).
If you are working with survey data, our guide on how to analyze survey data using SPSS may help you understand the process before writing your results.
How to Report Descriptive Statistics from Excel in APA
Excel can calculate basic descriptive statistics such as mean, standard deviation, count, minimum, and maximum. However, Excel output still needs to be rewritten before it is placed in an APA-style results section.
Suppose Excel gives these values:
| Statistic | Value |
|---|---|
| Mean | 73.4856 |
| Standard deviation | 8.9231 |
| Count | 120 |
You could report the result as:
The average test score was 73.49 (SD = 8.92), based on 120 participants.
This is clearer than pasting the Excel output directly into your paper.
Excel can be useful for simple summaries, but more complex projects may require SPSS, R, Stata, Python, or another tool. If you are comparing software options, you can read our guide on the top statistical software for dissertation data analysis.
Should You Report Descriptive Statistics Before Inferential Statistics?
Yes, in most quantitative results sections, descriptive statistics should come before inferential statistics. They give readers the background needed to understand the later analysis.
For example, before reporting an independent samples t-test, you should usually report the mean and standard deviation for each group. Before reporting a regression model, you may report descriptive statistics for the dependent and independent variables. Before reporting a chi-square test, you may report frequencies and percentages.
This does not mean you need a long descriptive section. The section should be long enough to summarize the sample and the main variables, but not so long that it distracts from the research questions.
A good rule is to report descriptive statistics that help readers understand your data and follow your analysis. Leave out values that do not add meaning.
Common Mistakes When Reporting Descriptive Statistics in APA
Many APA reporting errors come from copying software output without editing it. Your results section should not look like a screenshot from SPSS or Excel. It should look like a clear academic summary.
Common mistakes include:
- Reporting the mean without the standard deviation.
- Using too many decimal places.
- Reporting percentages without counts.
- Forgetting to mention the sample size.
- Using tables for one or two simple values.
- Repeating every value from a table in the text.
- Mixing descriptive statistics with interpretation.
- Reporting statistics that do not match the variable type.
- Ignoring missing data.
- Using inconsistent symbols or decimal places.
For example, this is weak:
The descriptive statistics showed a mean of 4.238576, standard deviation of .913842, variance of .835, skewness of -.427, and kurtosis of .116.
This is better:
Participants reported high satisfaction with the service (M = 4.24, SD = 0.91).
The second sentence is cleaner and easier to read.
Descriptive Statistics APA Reporting Checklist
Before finalizing your results section, use this checklist:
- Did you report the final sample size?
- Did you choose statistics that match the variable type?
- Did you report the mean and standard deviation together?
- Did you use frequencies and percentages for categorical variables?
- Did you use median or IQR for skewed data where appropriate?
- Did you round values consistently?
- Did you avoid unnecessary statistics?
- Did you use tables only when they improve clarity?
- Did you explain each table briefly in the text?
- Did you avoid pasting raw software output?
- Did you mention missing data where relevant?
- Did you keep the results factual and objective?
This checklist is especially useful for dissertation and thesis chapters because examiners often expect clear reporting, not just correct calculations.
If you need help preparing the analysis and writing the results in a thesis-ready format, our thesis data analysis help service explains the type of support available.
Need Help Reporting Descriptive Statistics in APA?
Reporting descriptive statistics can feel simple at first, but it becomes difficult when you have many variables, missing data, grouped results, or supervisor feedback to address. It can also be confusing when your software output does not match the format expected in your dissertation or thesis.
At DissertationDataAnalysisHelp.com, we help students and researchers turn raw output into clear results. This may include descriptive statistics, assumption checks, APA-style tables, interpretation, and full results chapter support.
You can get help with SPSS, Excel, R, Stata, Python, and other research tools. You can also receive support with deciding what to report, how to organize your results, and how to present your findings in a way that fits your research questions.
If your descriptive statistics are part of a wider quantitative project, our SPSS data analysis help page may also be useful.
Conclusion
Descriptive statistics are an important part of APA-style results reporting. They help readers understand your sample, variables, and basic data patterns before you present inferential tests.
To report descriptive statistics well, choose the right statistics for each variable type. Use mean and standard deviation for many continuous variables, frequencies and percentages for categorical variables, and median or interquartile range for skewed data. Keep your decimal places consistent, use clear APA symbols, and present larger sets of results in clean tables.
Most importantly, do not treat software output as the final result. SPSS, Excel, R, and Stata can calculate the numbers, but your job is to present those numbers in a clear and academic way. A strong APA results section should be accurate, readable, and directly connected to your research questions.
Frequently Asked Questions
Report the mean using M and the standard deviation using SD. Place both values in the sentence or in parentheses. For example, Participants reported moderate stress (M = 3.42, SD = 0.86).
Yes, statistical symbols such as M and SD are commonly italicized in APA-style writing. This also applies to many other statistical symbols, such as t, p, r, and N.
Use text when you only need to report a few values. Use a table when you have several variables, groups, or categories.
For example, one mean and standard deviation can be reported in a sentence. A full set of demographic characteristics is usually easier to read in a table.
Report both the count and the percentage when possible. For instance, the average score was 84.25 (SD = 9.31).
Usually, no. SPSS output is often too detailed and not formatted for APA-style writing. You should extract the important values and present them in clean sentences or APA-style tables. This makes your results section easier to read and more professional.
For a Likert scale score created by averaging or summing several items, researchers often report the mean and standard deviation. For a single ordinal item, frequencies, percentages, median, or interquartile range may be more suitable.
The best choice depends on your measurement approach, supervisor expectations, and analysis plan.

