Before you run many statistical tests in SPSS, you may need to check whether your data are approximately normally distributed. This step is important because tests such as the independent samples t-test, paired samples t-test, ANOVA, Pearson correlation, and linear regression often rely on normality assumptions.
The problem is that many students do not know where to find the normality test in SPSS. Others can run the test but struggle to interpret the output. The Tests of Normality table may show both Kolmogorov-Smirnov and Shapiro-Wilk results, and it is not always clear which one to use.
In this guide, you will learn how to do a normality test in SPSS using simple steps. You will also learn how to interpret Shapiro-Wilk, Kolmogorov-Smirnov, histograms, and Q-Q plots. By the end, you should be able to check normality, explain your results, and report the findings correctly in your dissertation, thesis, or research project.
Need expert support with SPSS output, assumption testing, or results interpretation? Our SPSS data analysis help service can help you prepare your data, run the right tests, and explain your results clearly.
How to Test Normality in SPSS: Quick Overview
To test normality in SPSS, use the Explore procedure. This is one of the easiest ways to get normality tests, histograms, and Q-Q plots in one output.
If you want a quick procedure for running the normality test in SPSS, follow these simple steps:
In SPSS Menu:
- Click Analyze.
- Select Descriptive Statistics.
- Click Explore.
- Move your continuous variable into the Dependent List box.
- Move your grouping variable into the Factor List box if you want to test normality by group.
- Click Plots.
- Tick Normality plots with tests.
- Click Continue.
- Click OK.
- Check the Tests of Normality table in the SPSS output.
In the output, focus mainly on the Sig. value. If the Sig. value is greater than .05, the data do not significantly differ from a normal distribution. If the Sig. value is less than .05, the data significantly differ from a normal distribution.
However, you should not rely on the p-value alone. Always check the histogram and Q-Q plot as well.
What Is a Normality Test in SPSS?
A normality test in SPSS checks whether a continuous variable is approximately normally distributed. A normal distribution is a bell-shaped distribution where most values are close to the mean, and fewer values appear at the extreme low and high ends.
In simple terms, a normality test helps you answer this question: Does my variable follow a roughly normal pattern?
SPSS can test normality using methods such as the Shapiro-Wilk test and the Kolmogorov-Smirnov test. These tests appear in the Tests of Normality table when you use the Explore procedure.
The null hypothesis for a normality test is that the data are normally distributed. This means:
- If p > .05, the normality assumption is not significantly violated.
- If p < .05, the data significantly depart from normality.
However, normality testing does not prove that your data are perfectly normal. Real research data are rarely perfect. The goal is to decide whether the distribution is acceptable for the analysis you want to run.
Why Normality Matters in SPSS Data Analysis
Normality matters because some statistical tests are based on assumptions about how the data are distributed. If these assumptions are badly violated, your results may be less reliable.
For example, normality is often checked before running:
- Independent samples t-test
- Paired samples t-test
- One-way ANOVA
- Repeated measures ANOVA
- Pearson correlation
- Linear regression
- ANCOVA
- MANOVA
In dissertation and thesis research, normality is often discussed in the assumptions section of the results chapter. Supervisors may ask whether you tested assumptions before running your main analysis.
Still, normality should not be treated as a mechanical rule. You need to consider your sample size, plots, outliers, and the test you plan to use.
If you are still deciding which statistical method fits your study, our guide on dissertation data analysis explains the broader process of preparing data, choosing tests, checking assumptions, and interpreting results.
When Should You Check Normality in SPSS?
You should check normality after cleaning your data and before running a statistical test that requires approximately normal data. This helps you decide whether a parametric test is suitable or whether another method may be needed.
For example, if you want to compare test scores between two teaching methods using an independent samples t-test, you should check whether the test scores are approximately normal within each group.
If you want to run a one-way ANOVA, you should check whether the dependent variable is approximately normal for each group of the independent variable. Do not only test the full sample if your analysis compares groups.
For regression analysis, the issue is slightly different. In many regression models, the assumption is about the normality of the residuals, not necessarily the raw dependent variable.
So, before testing normality, ask yourself:
- What statistical test am I planning to run?
- Which variable is the dependent variable?
- Do I need to check normality for the whole sample or by groups?
- Am I testing raw scores or residuals?
These questions help you avoid common mistakes.
Which Variables Can You Test for Normality?
Normality tests are mainly used for continuous variables. These are variables measured on a scale where the numbers represent meaningful quantities.
Examples of variables you can test for normality include:
- Exam scores
- Age
- Income
- Stress scores
- Anxiety scores
- Reaction time
- Blood pressure
- Job satisfaction scores
- Academic performance scores
You should not use a normality test for purely categorical variables such as gender, marital status, religion, department, or education category. These variables represent groups, not continuous measurements.
Likert scale totals or mean scores are often treated as continuous in research, especially when several items are combined into a scale. For example, a total stress score created from 10 questionnaire items may be checked for normality.
Before running a normality test, make sure your variable is correctly coded in SPSS. If your dataset needs recoding, computing scale scores, or transforming variables, you may find this guide on how to transform variables in SPSS helpful.
Shapiro-Wilk vs Kolmogorov-Smirnov Test in SPSS
SPSS often gives two normality tests in the output: the Kolmogorov-Smirnov test and the Shapiro-Wilk test. Both tests check whether a variable significantly differs from a normal distribution, but they are not always used in the same way.
As a practical rule, beginners can use the sample size as a guide. The Shapiro-Wilk test is usually preferred for small and moderate samples because it is more powerful at detecting non-normality. The Kolmogorov-Smirnov test is more commonly considered when working with larger samples, although it is generally less powerful and should not be used alone.
The following table provides a quick summary to help you make the right choice for your study.
| Sample Size | Test to Focus On | Beginner-Friendly Reason |
|---|---|---|
| n < 50 | Shapiro-Wilk | This is usually the preferred test for small samples. |
| n = 50 to 300 | Shapiro-Wilk | It remains a good choice for many moderate research samples. |
| n > 300 | Kolmogorov-Smirnov plus visual checks | For larger samples, also rely heavily on histograms and Q-Q plots. |
| Very large samples | Visual inspection becomes more important | Normality tests may flag tiny differences that do not matter in practice. |
For most dissertation and thesis datasets, the safest approach is to start with the Shapiro-Wilk test, especially when the sample size is small or moderate. If your sample is large, you can still look at Shapiro-Wilk, but you should give more weight to the histogram, Q-Q plot, skewness, kurtosis, and the type of analysis you plan to run.
The Kolmogorov-Smirnov test can be useful as supporting evidence in larger samples. However, do not make your decision based only on this test. Like Shapiro-Wilk, it can become significant when the sample size is large, even if the distribution is close enough to normal for practical analysis.
In simple terms, use this rule:
For small and moderate samples, focus on Shapiro-Wilk. For large samples, check Kolmogorov-Smirnov, but rely more on histograms, Q-Q plots, skewness, kurtosis, and research judgment.
Preliminary Checks Before Performing the Normality Test
Before you run a normality test in SPSS, do not rush straight to the output. A normality test is only useful when the data are prepared correctly, and the right variable is being tested.
Use these preliminary checks before performing the normality test:
- Confirm that the variable is continuous or scale-level. Normality testing is appropriate for variables such as exam scores, age, income, stress scores, anxiety scores, and test performance scores. It is not appropriate for nominal variables such as gender, marital status, ethnicity, department, or treatment group.
- Check for missing values. Missing data can affect the quality of the normality test, especially when many cases are missing. Before testing normality, check whether the missing values are few or whether they may affect your analysis.
- Look for impossible or incorrect values. Data entry errors can distort the shape of your distribution. For example, an age value of 250 or a score of 120 on a test marked out of 100 may make the data look non-normal when the real problem is incorrect coding.
- Decide whether to test normality for the full sample or by group. If your analysis compares groups, you should usually test the dependent variable within each group. For example, if you are comparing stress scores between males and females, check normality separately for males and females.
- Know the statistical test you plan to run. Normality is not checked in the same way for every analysis. For a t-test or ANOVA, you usually check the dependent variable within each group. However, for linear regression, you should check the normality of the residuals (not the raw dependent variable).
- Check for outliers before making a final decision. Outliers can strongly affect normality. If your data appear non-normal, check whether a few extreme values are causing the problem before choosing a transformation or non-parametric test.
How to Do a Normality Test in SPSS: Step by Step
This section shows you how to run a normality test in SPSS using the Explore procedure. This method gives you normality tests, descriptive statistics, and useful plots.
Step 1: Open Your Dataset in SPSS
Start by opening your dataset in SPSS. Make sure your data is arranged correctly.
Each row should represent one case, participant, or observation. Each column should represent one variable.
For example, if you collected data from students, each row should represent one student. Variables such as age, gender, anxiety score, and exam score should appear in separate columns.
Also, check that your variable names are clear. Names such as stress_score, exam_score, or anxiety_total are easier to understand than vague names such as var001.
Before you continue, confirm that the variable you want to test is numeric. SPSS cannot properly test normality for a text variable.
Step 2: Click Analyze
Go to the top menu in SPSS and click Analyze.
This menu contains most statistical procedures in SPSS. You will use it for descriptive statistics, assumption checks, hypothesis tests, regression, ANOVA, and many other analyses.
For normality testing, you do not need to go directly to Compare Means or Regression. Instead, you will use the Explore option under Descriptive Statistics.
This is useful because Explore gives you both numerical and visual output. You can get Shapiro-Wilk, Kolmogorov-Smirnov, histograms, boxplots, and Q-Q plots from the same procedure.
Step 3: Select Descriptive Statistics and Explore
After clicking Analyze, move your cursor to Descriptive Statistics.
Then click Explore.
The path is:
Analyze → Descriptive Statistics → Explore
A new dialog box will open. This is where you will choose the variable you want to test for normality.
The Explore dialog box has several areas, but the most important ones are:
- Dependent List
- Factor List
- Label Cases By
- Statistics
- Plots
- Options
For a basic normality test, you will mainly use the Dependent List and Plots buttons.
Step 4: Move Your Variable Into the Dependent List
In the Explore dialog box, find the variable you want to test for normality.
Click the variable, then move it into the Dependent List box.
For example, if you want to test whether exam scores are normally distributed, move exam_score into the Dependent List.
The Dependent List is where SPSS expects the continuous variable you want to examine. You can move more than one variable into this box if you want to test several variables at once.
However, beginners should start with one variable. This makes the output easier to read.
Remember, the dependent variable should be numeric and continuous. Do not place categorical grouping variables in the Dependent List.
Step 5: Add a Grouping Variable If Needed
If your analysis compares groups, move your grouping variable into the Factor List box.
For example, suppose you want to test whether stress scores are normally distributed separately for males and females. You would move stress_score into the Dependent List and gender into the Factor List.
Other possible grouping variables include:
- Treatment group
- Control group
- Education level
- Study program
- Employment status
- Teaching method
When you use the Factor List, SPSS produces separate normality results for each group.
This is important because the full sample may look normal while one group is not normally distributed. For group comparison tests, normality should usually be checked within each group.
If you are not comparing groups, you can leave the Factor List empty.
Step 6: Click Plots
Next, click the Plots button on the right side of the Explore dialog box.
A new window will open. This is where you request the normality test and normality plots.
Look for the option called Normality plots with tests. Tick this box.
This option tells SPSS to produce:
- Tests of normality
- Normal Q-Q plots
- Detrended normal Q-Q plots
Depending on your SPSS version, you may also see options for histograms, stem-and-leaf plots, or boxplots.
After selecting Normality plots with tests, click Continue.
This will return you to the main Explore dialog box.
Step 7: Click OK
After selecting your variable and ticking Normality plots with tests, click OK.
SPSS will run the analysis and open the output window.
The output may include several tables and graphs. Do not worry if it looks long at first. For normality testing, the most important parts are:
- Descriptives table
- Tests of Normality table
- Histogram
- Normal Q-Q plot
- Boxplot, if shown
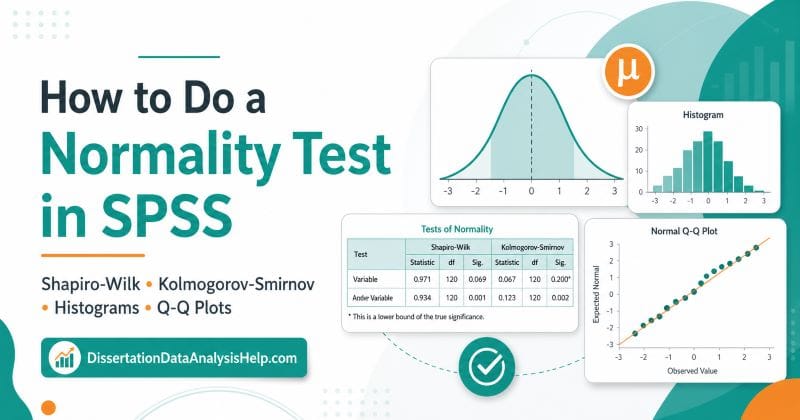
The table you should check first is the Tests of Normality table. This table gives the Shapiro-Wilk and Kolmogorov-Smirnov results.
SPSS Syntax for Normality Testing
SPSS also allows you to run a normality test using syntax. Syntax is useful because it records exactly what you did. This can help when you need to repeat the analysis or document your process.
Here is a simple syntax example:
EXAMINE VARIABLES=exam_score
  /PLOT BOXPLOT STEMLEAF NPPLOT
  /COMPARE GROUPS
  /STATISTICS DESCRIPTIVES
  /CINTERVAL 95
  /MISSING LISTWISE
  /NOTOTAL.
If you want to test normality by group, you can use syntax like this:
EXAMINE VARIABLES=exam_score BY gender
  /PLOT BOXPLOT STEMLEAF NPPLOT
  /COMPARE GROUPS
  /STATISTICS DESCRIPTIVES
  /CINTERVAL 95
  /MISSING LISTWISE.
In this example, exam_score is the continuous variable, while gender is the grouping variable.
You can replace these names with the actual variable names in your dataset. Make sure you type the names exactly as they appear in SPSS Variable View.
How to Read the Tests of Normality Table in SPSS
The Tests of Normality table is the main table used to interpret normality in SPSS.
The table usually contains two tests:
- Kolmogorov-Smirnov
- Shapiro-Wilk
Each test has three main columns:
- Statistic
- df
- Sig.
The most important column for beginners is Sig. This is the p-value.
Use this rule:
| SPSS Sig. Value | Meaning |
|---|---|
| p > .05 | Normality is not significantly violated (we can assume the data is approximately nornally distributed) |
| p < .05 | The data significantly differ from normality |
| p = .000 | Normality is not significantly violated (we can assume the data is approximately normally distributed) |
For example, if the Shapiro-Wilk Sig. value is .218, you can say the variable does not significantly depart from normality. However, if the Shapiro-Wilk Sig. value is .003, you can say the variable significantly departs from normality.
Note. You should not stop there. You should also inspect the histogram and Q-Q plot before making your final decision.
How to Interpret the Shapiro-Wilk Test in SPSS
The Shapiro-Wilk test checks whether your data significantly differ from a normal distribution.
In SPSS, look at the Sig. value under the Shapiro-Wilk section of the Tests of Normality table.
If the Sig. value is greater than .05, the result is not statistically significant. This means the data do not significantly depart from normality.
Example:
The Shapiro-Wilk test was not significant, p = .156. This suggests that the normality assumption was not significantly violated.
If the Sig. value is less than .05, the result is statistically significant. This suggests that the data significantly differ from a normal distribution.
Example:
The Shapiro-Wilk test was significant, p = .012. This suggests that the scores significantly departed from normality.
Be careful with wording. Do not say that the data are “perfectly normal.” It is better to say that the normality assumption was not significantly violated.
How to Interpret the Kolmogorov-Smirnov Test in SPSS
The Kolmogorov-Smirnov test also checks whether your data differ from a normal distribution. SPSS often reports it in the same table as the Shapiro-Wilk test.
The interpretation is similar:
- If p > .05, the result is not significant.
- If p < .05, the result is significant.
However, the Kolmogorov-Smirnov test can be sensitive to sample size. In large samples, even small differences from normality may become statistically significant.
For this reason, many students focus more on the Shapiro-Wilk test and then use graphs to support the decision.
For example, if the Kolmogorov-Smirnov test is significant but the histogram and Q-Q plot look acceptable, the data may still be suitable for some parametric tests, especially with a large sample.
The main point is simple: do not interpret the Kolmogorov-Smirnov test alone. Use it together with Shapiro-Wilk, histograms, Q-Q plots, and your research context.
How to Interpret a Histogram in SPSS
A histogram helps you see the shape of your data. When checking normality, look for a roughly bell-shaped pattern. This means most scores are near the center, with fewer scores at the lower and upper ends.
A histogram may suggest normality if:
- The bars form a rough bell shape.
- The distribution is not strongly skewed.
- There are no extreme outliers.
- The data are not heavily clustered at one end.
A histogram may suggest non-normality if:
- The data are strongly skewed to the left or right.
- There are extreme outliers.
- The distribution has two or more peaks.
- Most values are crowded near the minimum or maximum.
Do not expect a perfect bell curve. Real datasets rarely look perfect, especially when the sample size is small.
A histogram is best used as a visual support, not as the only normality decision.
How to Interpret a Q-Q Plot in SPSS
A Q-Q plot compares your observed data with the pattern expected under a normal distribution. In SPSS, the normal Q-Q plot shows points and a diagonal line. If the data are approximately normal, the points should fall close to the diagonal line.
Therefore, the data may be approximately normal if:
- Most points follow the diagonal line.
- Small deviations appear only at the ends.
- There is no strong curve or S-shape.
The data may not be normal if:
- Points strongly curve away from the line.
- The pattern forms an S-shape.
- Several points are far away from the line.
- The ends of the plot show large departures.
Small deviations are common. You should not reject normality only because a few points do not sit exactly on the line.
When the p-value and Q-Q plot disagree, look at the bigger picture. Consider sample size, outliers, skewness, and the test you plan to run.
How to Test Normality by Group in SPSS
Testing normality by group is important when your main analysis compares groups.
For example, suppose you want to compare anxiety scores between a treatment group and a control group. You should check whether anxiety scores are approximately normal in each group.
To test normality by group in SPSS:
- Click Analyze.
- Go to Descriptive Statistics.
- Click Explore.
- Move the continuous variable into Dependent List.
- Move the grouping variable into Factor List.
- Click Plots.
- Tick Normality plots with tests.
- Click Continue.
- Click OK.
SPSS will produce normality results for each group.
This matters because the overall sample may appear normal even when one group is skewed. For tests such as t-tests and ANOVA, the assumption usually applies to the dependent variable within each group.
If you are unsure whether your data require grouped assumption testing, our dissertation statistics help service can help you choose the right approach.
Example of a Normality Test in SPSS
Let us use a simple example.
A student wants to know whether stress scores are normally distributed before comparing stress levels between male and female students.
The variables are:
- Continuous variable:
stress_score - Grouping variable:
gender
The student follows these steps:
- Clicks Analyze.
- Selects Descriptive Statistics.
- Clicks Explore.
- Moves
stress_scoreinto the Dependent List. - Moves
genderinto the Factor List. - Clicks Plots.
- Ticks Normality plots with tests.
- Clicks Continue.
- Clicks OK.
SPSS then produces a Tests of Normality table for each gender group.
Suppose the Shapiro-Wilk results are:
| Group | Shapiro-Wilk p-value |
|---|---|
| Male | .084 |
| Female | .112 |
Because both p-values are greater than .05, the normality assumption is not significantly violated for either group.
The student should still check the histogram and Q-Q plot before making the final decision.
How to Report Normality Test Results in APA Style
When reporting normality test results, keep the wording clear and concise. You do not need to over-explain the output.
If the normality assumption is not violated, you may write:
Normality was assessed using the Shapiro-Wilk test. The result was not statistically significant, W = .981, p = .214, suggesting that the normality assumption was not significantly violated.
However, if the data are not normally distributed, you may write:
The Shapiro-Wilk test was statistically significant, W = .921, p = .003, suggesting that the scores significantly departed from normality.
If you are reporting normality by group, you may write:
Normality was assessed using the Shapiro-Wilk test. The assumption was not significantly violated for the control group, W = .974, p = .156, or the treatment group, W = .968, p = .091.
If SPSS reports .000, do not write p = .000. Write p < .001.
What If Your Data Are Not Normally Distributed?
If your data are not normally distributed, do not panic or rush to change your analysis. Non-normal data are common in dissertation and thesis research. The most important thing is to understand why the data are non-normal and whether the problem is serious enough to affect your planned statistical test.
Here are the main steps to follow:
- Check for data entry errors.
A single wrong value can make your distribution look non-normal. For example, an age value of 250 or a questionnaire score outside the possible range may distort your results. Correct clear errors before making any statistical decision. - Inspect outliers.
Extreme values can pull the distribution to one side and affect the normality test. Use boxplots, descriptive statistics, and plots to see whether a few unusual cases are causing the problem. - Look at the histogram and Q-Q plot.
Do not rely only on the p-value. A significant normality test does not always mean the data are unusable, especially when the sample size is large. If the histogram looks reasonably bell-shaped and the Q-Q plot points are close to the line, the distribution may still be acceptable. - Consider whether your planned test is robust.
Some parametric tests can tolerate moderate non-normality, especially when the sample size is large and group sizes are fairly balanced. This is why you should consider the test, sample size, and visual plots together. - Consider transforming the variable.
If the distribution is strongly skewed, you may consider a log, square root, or reciprocal transformation. However, transformation should be used carefully because it can make results harder to interpret. - Use a non-parametric alternative if needed.
If the normality violation is serious and the transformation is not appropriate, you may use a non-parametric test.
Common Mistakes When Testing Normality in SPSS
Many students make mistakes when checking normality. These mistakes can affect the quality of the results section.
Here are common mistakes to avoid:
- Testing categorical variables for normality.
- Testing the full sample when normality should be checked by group.
- Looking only at the p-value and ignoring plots.
- Treating p > .05 as proof that the data are perfectly normal.
- Reporting SPSS output as p = .000.
- Forgetting to check outliers.
- Using normality tests before cleaning the dataset.
- Assuming every analysis requires raw variables to be normally distributed.
- Ignoring sample size when interpreting normality tests.
- Running a transformation without explaining why it was needed.
A good normality check should combine statistical tests, visual inspection, and research judgment. This gives a stronger and more defensible interpretation.
Should You Always Transform Non-Normal Data?
No. You should not automatically transform data just because the normality test is significant.
Transformation can help in some cases, but it can also make interpretation harder. For example, if you transform income using a log transformation, the results no longer refer to the original income values directly.
Before transforming data, ask:
- Is the non-normality serious?
- Are there outliers causing the problem?
- Is the sample size large?
- Does the planned test tolerate some non-normality?
- Will the transformation make the results harder to explain?
- Is there a suitable non-parametric test instead?
In dissertation research, you should also consider your supervisor’s expectations and your methodology plan.
Transformation is a statistical decision, not just a software step. If you use it, explain what you transformed, why you transformed it, and how it affected your analysis.
Conclusion
Testing normality in SPSS is easier once you know where to find the right option. The main route is Analyze → Descriptive Statistics → Explore → Plots → Normality plots with tests.
After running the test, check the Tests of Normality table, especially the Shapiro-Wilk Sig. value. Then inspect the histogram and Q-Q plot to understand the shape of the data. If you are comparing groups, test normality within each group instead of only checking the full sample.
A good normality decision should not depend on one number alone. It should consider the p-value, graphs, sample size, outliers, and the statistical test you plan to run.
If your data are not normally distributed, you still have options. You can check for errors, examine outliers, consider transformation, use a robust approach, or choose a non-parametric test.
Need help checking assumptions, running SPSS tests, or writing your results clearly? Our help with SPSS analysis service can support you from data preparation to final interpretation.
Frequently Asked Questions
Use the Explore procedure. Move the continuous variable into the Dependent List and the grouping variable into the Factor List. SPSS will produce normality results for each group.
The Sig. value is the p-value. If the Sig. value is greater than .05, the normality assumption is not significantly violated. If it is less than .05, the data significantly differ from normality.
A p-value less than .05 means the data significantly depart from a normal distribution. This does not always mean your analysis is impossible, but it means you should inspect plots, outliers, and possible alternatives.
Sometimes, yes. The t-test can be fairly robust in some situations, especially with larger samples. However, you should check the seriousness of the violation, group sizes, outliers, and your research context.
Many researchers focus on the Shapiro-Wilk test, especially for small to moderate samples. However, you should also inspect histograms and Q-Q plots instead of relying on one test alone.

